TL;DR: kube-opex-analytics is a new open-source tool designed to help you track resource usage and allocate costs per namespace. It's lightweight, easy to deploy, and features built-in GPU tracking capabilities.
The Hidden Cost of Kubernetes
If you're running Kubernetes, you know the drill: Setting requests and limits is an art, and paying the cloud bill is a painful reality.
We've all been there—over-provisioning "just in case," or wondering why the cluster autoscaler is spinning up nodes when half the pods are idle. Efficiency is hard to track without expensive enterprise tools.
That's why I built kube-opex-analytics.
What is kube-opex-analytics?
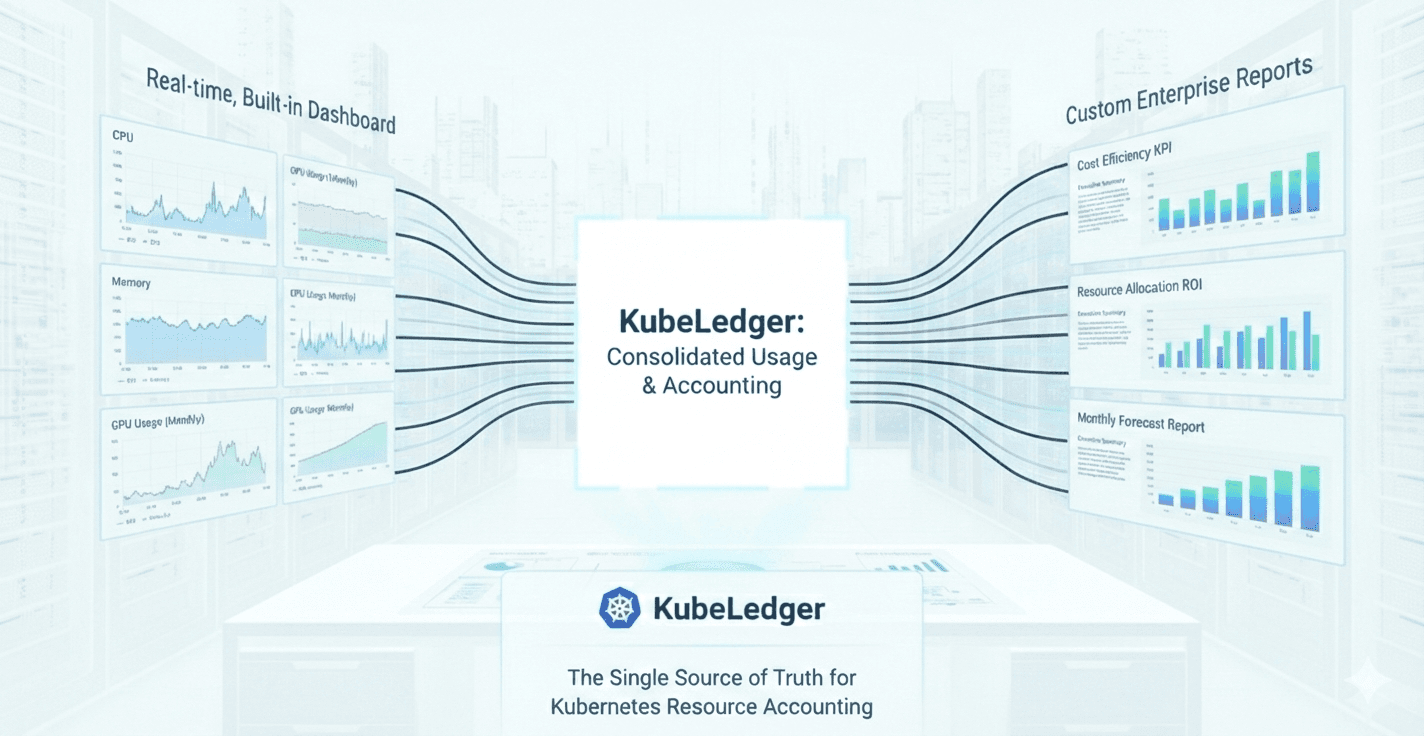
kube-opex-analytics is an open-source tool designed to give you instant visibility into your Kubernetes cluster's resource consumption and cost allocation.
It focuses on what matters most for cost optimization:
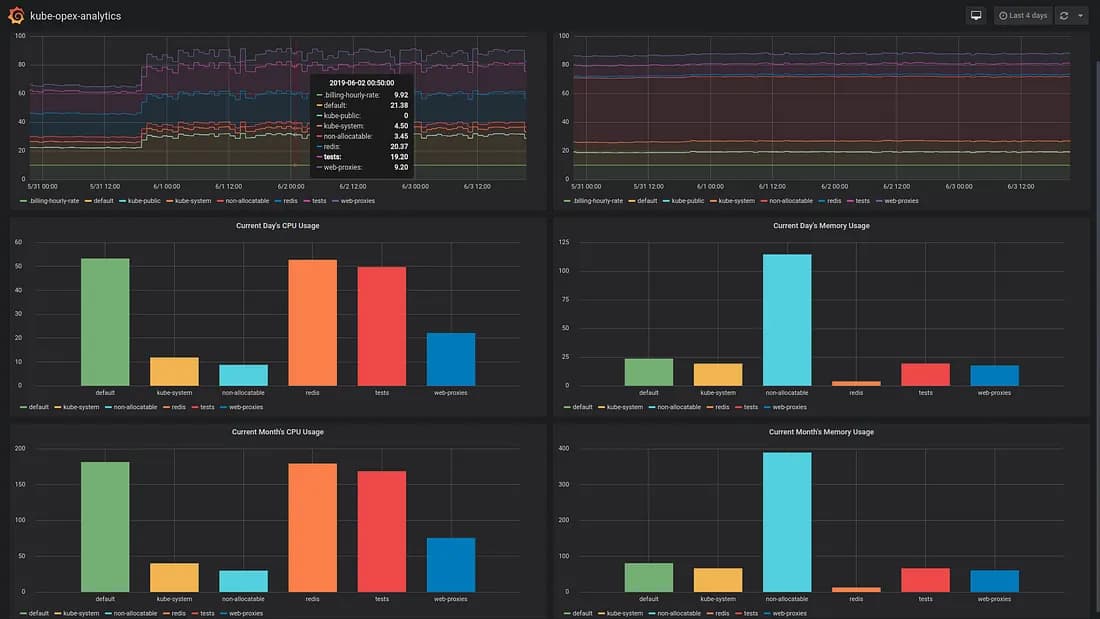
Actual Usage vs. Requests: See exactly how much CPU and Memory your namespaces are using compared to what they reserved.
Cost Allocation: Break down costs per namespace based on flexible billing models.
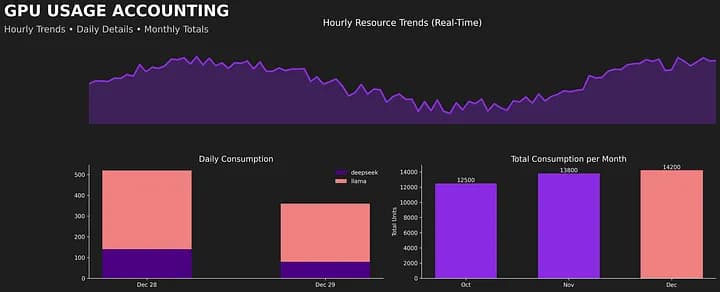
Trends Over Time: visualize hourly, daily, and monthly trends to spot patterns.
GPU Support: First-class citizen support for tracking NVIDIA GPU utilization (because those resources are very expensive!).

Key Features
1. 📊 Real-time & Historical Analytics
Unlike some tools that only show "now," kube-opex-analytics consolidates metrics into hourly, daily, and monthly views. This is crucial for spotting that 3 AM spike or the weekend idle time.
2. 💰 Cost Chargeback & Showback
Want to show the Data Science team how much their experiments are costing? The tool allows you to set hourly rates or use a ratio-based cost model to generate accurate cost reports per namespace.
3. 📉 Efficiency Analysis
The "Usage Efficiency" view overlays your actual resource usage against your requested capacity. This is your "aha!" moment for right-sizing pods.
4. 🧠 GPU Metrics
With the rise of AI/ML workloads, GPU visibility is non-negotiable. We integrate with the NVIDIA DCGM exporter to show you who is actually saturating those A100s.
Quick Start 🚀
You can have it running in your cluster in less than 2 minutes.
Using Kustomize:
kubectl create namespace kube-opex-analytics
kubectl apply -k https://github.com/rchakode/kube-opex-analytics/manifests/kustomize -n kube-opex-analytics
Using Helm:
git clone https://github.com/rchakode/kube-opex-analytics.git --depth=1
cd kube-opex-analytics
kubectl create namespace kube-opex-analytics
helm upgrade --install kube-opex-analytics ./manifests/helm -n kube-opex-analytics
kubectl get pods -n kube-opex-analytics -w
Once deployed, just port-forward to see the dashboard:
kubectl port-forward svc/kube-opex-analytics 5483:80 -n kube-opex-analytics
Open http://localhost:5483 and start optimizing!
Why Open Source?
Cloud cost management shouldn't be a luxury. By making this tool open source, I hope to help DevOps engineers and platform teams get the visibility they need without the enterprise price tag.
We are actively looking for contributors! Whether it's a new dashboard feature, a helm chart tweak, or just a bug report—your input is welcome.
Give it a spin and let me know what you think in the comments! 👇