What 6 Months of Tracking a Production OpenShift Cluster Revealed About Kubernetes Costs
Ph.D. in Cloud Computing & Founder @ RealOps Labs. Expert in OpenShift Ecosystem & Multi-Cloud Kubernetes. Polyglot Engineer (Go/C++/Python). Building open-source observability tools.
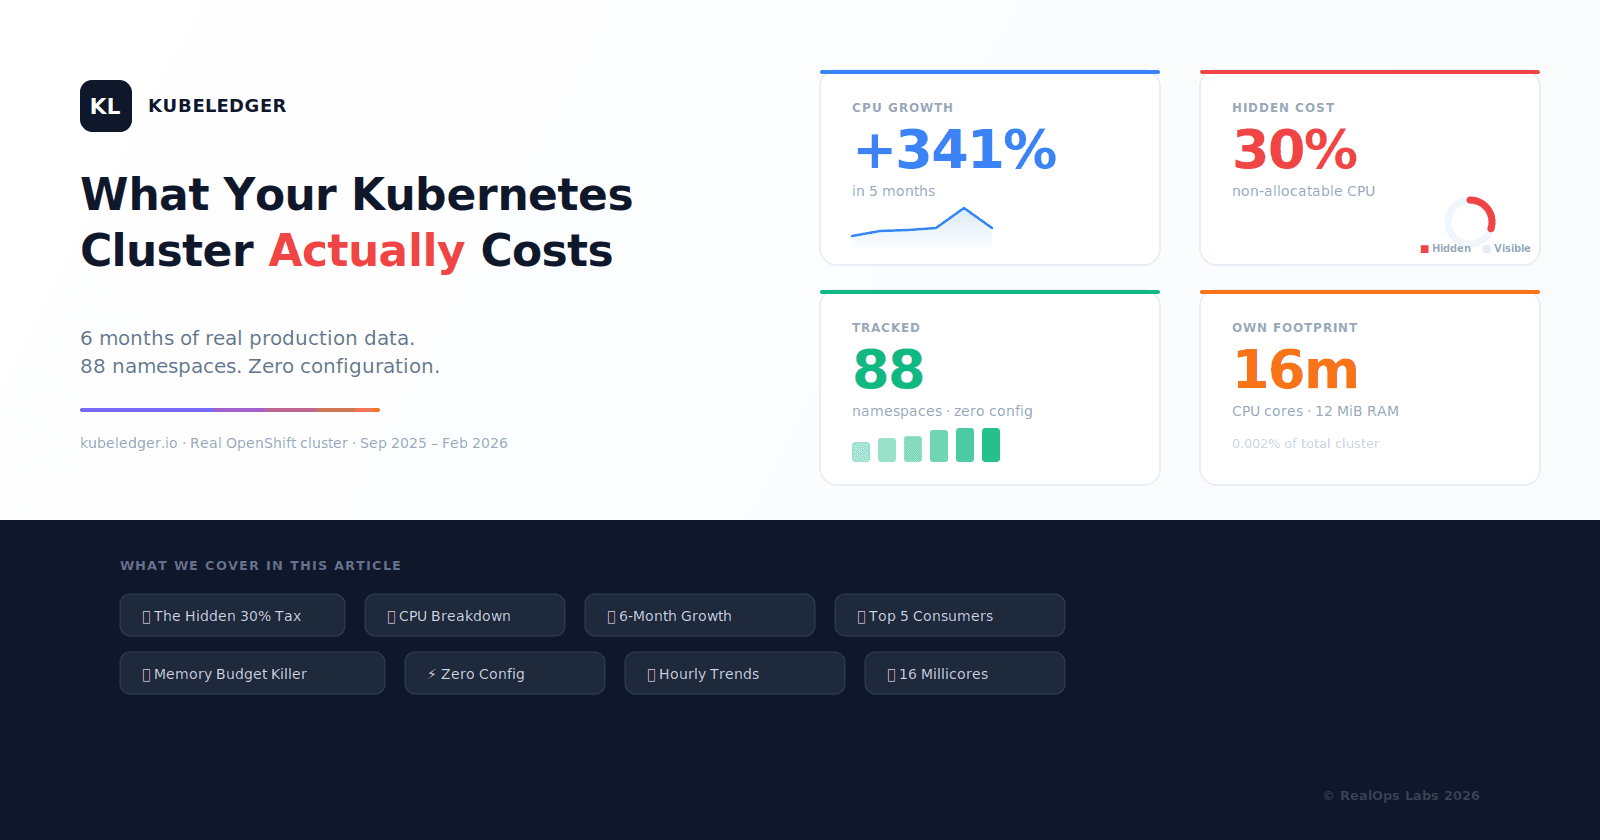
Most Kubernetes teams track pod CPU and memory. Almost none track what the cluster actually costs to run.
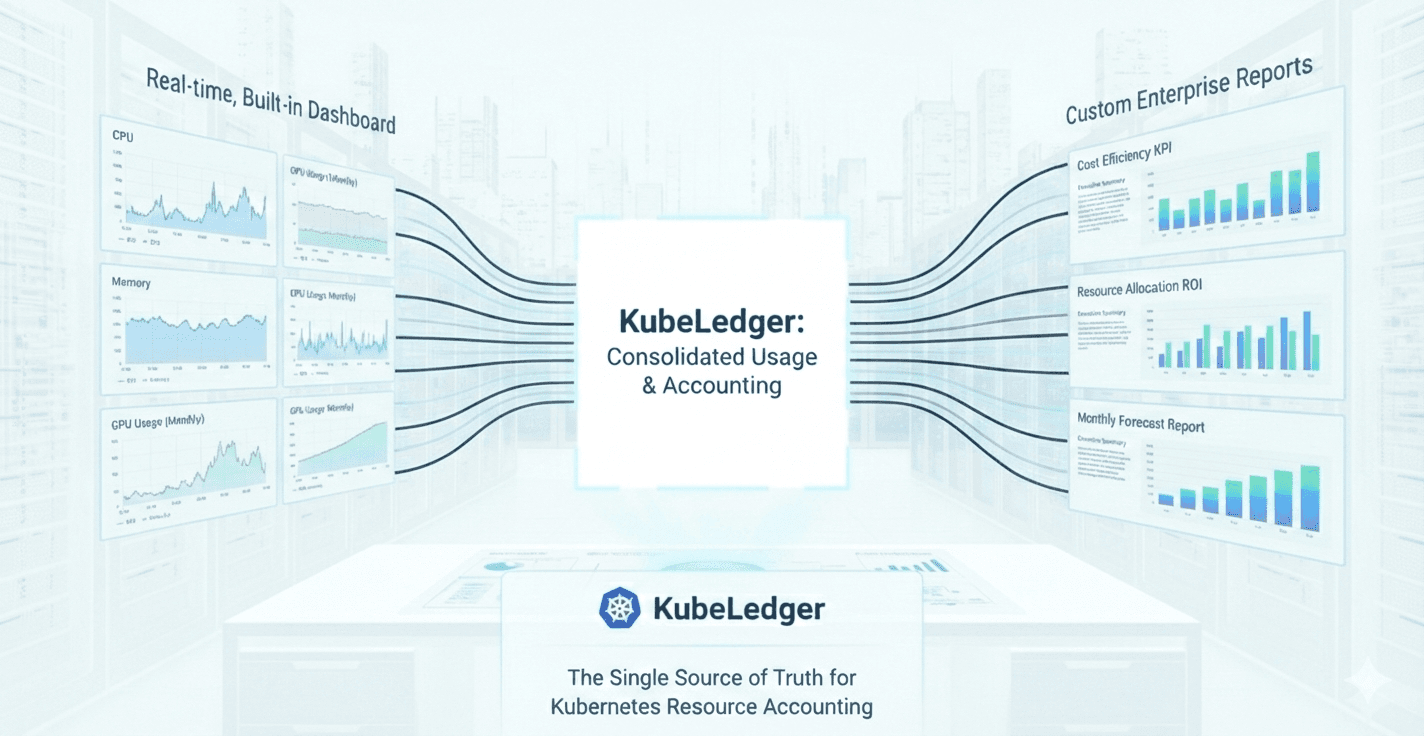
We decided to change that. For the past 6 months, we have been running KubeLedger on our own OpenShift cluster — the one we use daily to manage hosted control planes, multi-cluster operations, and security workloads.
The results were eye-opening. Here is what we found, with real numbers and zero embellishment.
1. The Hidden 30% Tax
Every Kubernetes node reserves resources for the operating system, kubelet, and system daemons. These resources are called non-allocatable — they are consumed but can never be scheduled to pods.
24–30% of total CPU was non-allocatable — consistent across every month for 6 months, never dropping below 24%.
On our cluster, non-allocatable overhead consumed between 24% and 30% of total CPU every single month. That means for every 10 cores you pay for, 2.5 to 3 cores are invisible to kubectl top nodes.
Most monitoring tools report namespace-level usage and call it a day. They show you what pods consumed, but not the gap between what the node provides and what can actually be scheduled. This gap is your hidden tax.
KubeLedger tracks both sides: allocatable and non-allocatable. Because you cannot optimize what you cannot see.
2. Where CPU Actually Goes
When we broke down CPU consumption by functional category, the picture became clear:
| Category | CPU Share | What It Includes |
|---|---|---|
| Platform (OpenShift) | 31% | API Server, etcd, OVN, monitoring, OLM, DNS |
| Non-Allocatable | 30% | OS, kubelet, system daemons |
| Multi-cluster (ACM) | 16% | Hub controllers, observability, agents |
| Hosted Control Planes | 14% | HCP #1 and HCP #2 API servers |
| Security (ACS) | 8% | StackRox/RHACS operator and services |
| Other | 1% | Storage, networking, misc operators |
Only ~14% of CPU was available for hosted workloads. The remaining 86% was infrastructure tax — the cost of running the platform itself.
This is not unusual. Most enterprise OpenShift clusters with ACM, ACS, and ODF will see similar ratios. The difference is whether you can see it or not.
3. Growth Nobody Noticed: 840 to 3,708 Cores
KubeLedger tracked total cluster CPU consumption month by month:
| Month | Total CPU (cores) | Change |
|---|---|---|
| Sep 2025 | 840 | Baseline |
| Oct 2025 | 1,796 | +114% |
| Nov 2025 | 1,808 | +1% |
| Dec 2025 | 1,928 | +7% |
| Jan 2026 | 3,708 | +92% |
| Feb 2026 | 1,936 | -48% (partial month) |
+341% CPU growth from September 2025 to January 2026 — driven by HCP rollout, ACM scaling, and ACS deployment.
The jump from September to January was driven by three events: the rollout of two hosted control planes (December), ACM scaling to manage additional clusters, and the deployment of the full ACS security stack.
Without historical tracking, this growth would have been invisible until the infrastructure bill arrived. KubeLedger stores 12 months of history with zero database management, powered by RRDtool.
Capacity planning starts with data. Not guesswork.
4. Top 5 Consumers Own 72% of CPU
In February 2026, just five namespaces consumed 72% of all allocatable CPU:
| Rank | Namespace | CPU (cores) | Share |
|---|---|---|---|
| #1 | open-cluster-management (ACM) | 187.6 | 26% |
| #2 | rhacs-operator (ACS) | 155.6 | 22% |
| #3 | clusters-hcp2 | 140.4 | 10% |
| #4 | clusters-hcp1 | 134.8 | 10% |
| #5 | openshift-kube-apiserver | 115.8 | 8% |
This is per-namespace accounting — the foundation for chargeback and showback. When a platform team can show exactly which components consume which resources, conversations about infrastructure cost become data-driven instead of political.
KubeLedger is the System of Record that makes this data available without Prometheus queries or custom dashboards.
5. Memory: The Silent Budget Killer
CPU gets all the attention in Kubernetes capacity discussions. Meanwhile, memory quietly drains budgets.
In January 2026, our cluster consumed 25 TiB of cumulative memory:
| Category | Memory (TiB) | Share |
|---|---|---|
| Platform (OpenShift) | 10.6 | 42% |
| Multi-cluster (ACM) | 3.9 | 16% |
| Security (ACS) | 3.9 | 15% |
| Hosted Clusters | 3.2 | 13% |
| Storage backends | 2.3 | 9% |
| Non-Allocatable | 0.8 | 3% |
| Other | 0.3 | 1% |
Memory is often the first resource to hit limits — and the hardest to debug when OOM kills start cascading across pods. Unlike CPU, which can be throttled, memory pressure causes immediate evictions.
KubeLedger tracks CPU and memory side by side, per namespace, over time. Because optimizing one while ignoring the other is half a strategy.
6. 88 Namespaces, Zero Configuration
Over the 6-month tracking period, our cluster grew from 77 to 88 namespaces:
| Month | Namespaces | New additions |
|---|---|---|
| Sep 2025 | 77 | Baseline |
| Oct 2025 | 80 | +3 (operators) |
| Nov 2025 | 81 | +1 |
| Dec 2025 | 87 | +6 (HCP namespaces) |
| Jan 2026 | 88 | +1 |
| Feb 2026 | 88 | Stable |
KubeLedger auto-discovers every namespace on the cluster and starts tracking immediately. No labels to add. No annotations to configure. No Prometheus rules to write.
Every new namespace was automatically picked up — including the HCP namespaces that appeared in December when we rolled out hosted control planes.
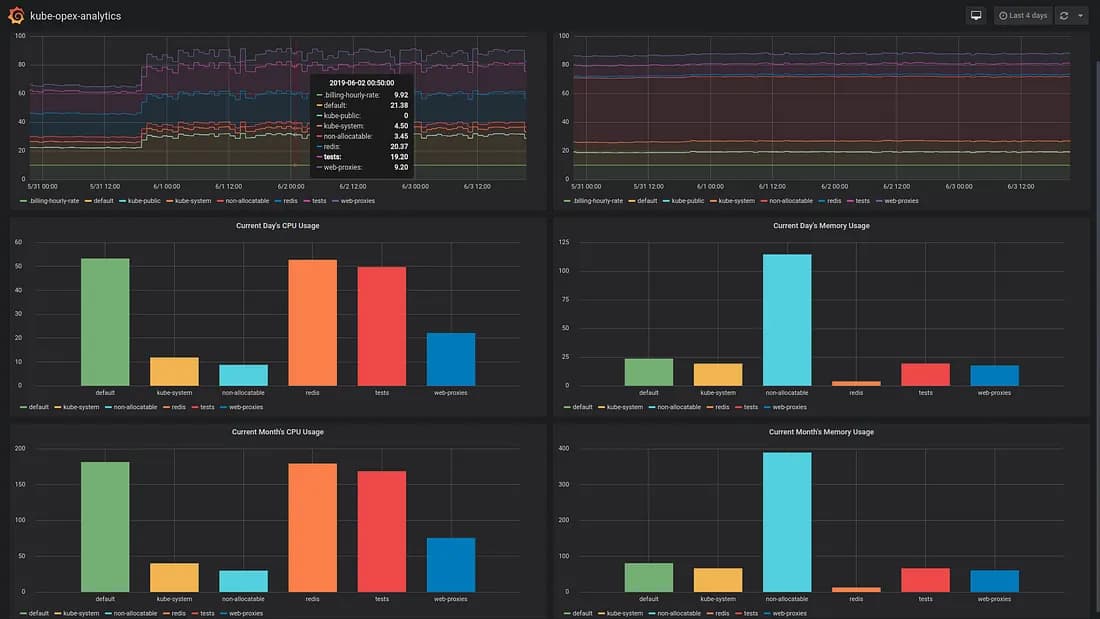
7. Hourly Trends Reveal What Daily Averages Hide
KubeLedger captures hourly granularity, revealing patterns that daily averages smooth away:
API Server: peaks at 0.7 cores during business hours, drops to 0.4 at night
ACM: bursts up to 1.0 core during reconciliation cycles, with a baseline of 0.66
Monitoring: fluctuates 0.3–0.7 cores depending on scrape intervals and alert evaluation
HCP #2: shows the widest variance (0.45–1.25 cores) due to workload scheduling patterns
These patterns matter for right-sizing. If you provision based on daily averages, you will either overprovision (wasting money) or underprovision (risking throttling during peaks).
Daily averages hide the peaks. KubeLedger does not.
8. A Cost Monitoring Tool That Costs Almost Nothing
We believe a cost monitoring tool should not cost you a fortune to run. Here is what KubeLedger consumes on the cluster it monitors:
0.016 cores / 12 MiB — that is 0.002% of total cluster CPU, tracking 88 namespaces with 12 months of history.
For context, KubeLedger uses less CPU than a single sidecar container. The tool tracking 88 namespaces with hourly, daily, and monthly granularity runs on 16 millicores.
How? No Prometheus dependency. No external database. No storage backend to scale. KubeLedger uses RRDtool for fixed-size, append-only storage that never grows beyond its initial allocation.
Less than 100 MB of storage for 1 year of retention. Deploy and get answers.
Conclusion: You Cannot Optimize What You Cannot See
Six months of tracking our own cluster taught us three things:
The hidden tax is real. 24–30% of CPU is non-allocatable and invisible to most tools. If you are not tracking it, you are underestimating your actual infrastructure cost.
Growth is gradual until it is not. Our cluster went from 840 to 3,708 cores in 5 months. Without historical tracking, this is invisible until the bill arrives.
Per-namespace accounting changes conversations. When you can show exactly which components consume which resources, cost discussions become evidence-based.
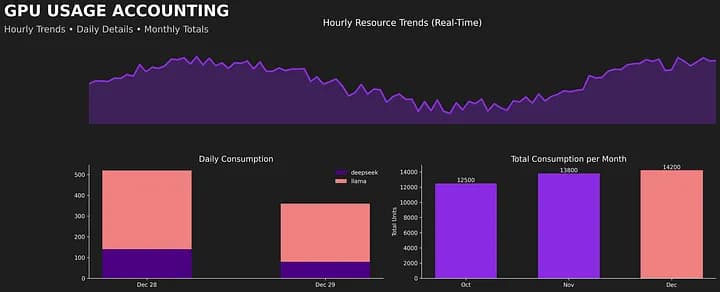
And this is just CPU and memory. KubeLedger also tracks NVIDIA GPU utilization and memory consumption per pod — with the same per-namespace accounting, powered by DCGM Exporter metrics. As AI workloads drive GPU costs through the roof, the same visibility gap exists: teams pay for expensive GPUs without knowing how they are actually consumed.
KubeLedger is the open-source System of Record that tracks the full picture of Kubernetes costs — revealing the 30% hidden in non-allocatable overhead for precise, per-namespace accounting.
Try KubeLedger
Deploy on your cluster in under 5 minutes. Zero configuration. Zero database. Full visibility.
Website: kubeledger.io
Follow RealOps Labs on LinkedIn for more production insights.
Appendix: Methodology
Cluster: OpenShift 4.x bare-metal, multi-node, running ACM, ACS, CNV, and ODF.
Tracking period: September 2025 – February 2026 (6 months).
Tool: KubeLedger (formerly kube-opex-analytics), deployed as a single pod with read-only RBAC access.
Data source: Kubernetes Metrics API (resource.metrics.k8s.io) polled at 5-minute intervals.
Non-allocatable calculation: Total node capacity minus allocatable capacity, as reported by the Kubernetes API.
Storage: RRDtool round-robin databases. Fixed-size, no external database required.
All data in this article comes from real CSV exports of KubeLedger running on our own OpenShift lab cluster. No data was simulated or adjusted.