This story introduces a Prometheus Exporter along with a Grafana Dashboard intending to provide cost-oriented consolidated resource usage analytics for Kubernetes clusters. Those analytics actually aim at highlighting factual metrics to help organizations easily make cost allocation and capacity planning decisions on short-, mid-, and long terms.
Sidenote: Readers may also be interested in this related story
Introduction
A couple of months ago Kubernetes Opex Analytics has been introduced as an original open source resource usage analytics tool to make cost sharing and capacity planning decisions easy on Kubernetes clusters. Released under the terms of Apache 2.0 License the tool comes with built-in analytics charts covering various use cases. It received a lot of user feedback, some requesting the ability to expose its metrics to existing Prometheus environments.
A Prometheus exporter has been introduced in version 0.3.0, so in this story I’ll be pleased to introduce and describe it. This comes along with an integrated Grafana dashboard to let users easily getting started. All that comes in complement of the native Kubernetes Opex Analytics features and dashboard.
What will be covered next
The story will give details on the exposed metrics and provide steps to setup the Exporter and the provided Grafana dashboard. Before that we’ll review the core features of Kubernetes Opex Analytics for readers not familiar with it.
If you’re already familiar with the concepts of Kubernetes Opex Analytics, you can skip the next section and move forward.
Kubernetes Opex Analytics in a Nutshell
Kubernetes Opex Analytics is designed on the following core concepts:
Namespace-focused: Means that consolidated resource usage metrics consider individual namespaces as fundamental units for resource sharing. A special care is taken to also account and highlight non-allocatable resources .
Hourly Usage & Trends: Like on public clouds, resource use for each namespace is consolidated on a hourly-basic. This actually corresponds to the ratio (%) of resource used per namespace during each hour. It’s the foundation for cost calculation and also allows to get over time trends about resources being consuming per namespace and also at the Kubernetes cluster scale.
Daily and Monthly Usage Costs: Provide for each period (daily/monthly), namespace, and resource type (CPU/memory), consolidated cost computed given one of the following ways: (i) accumulated hourly usage over the period; (ii) actual costs computed based on resource usage and a given hourly billing rate; (iii) normalized ratio of usage per namespace compared against the global cluster usage.
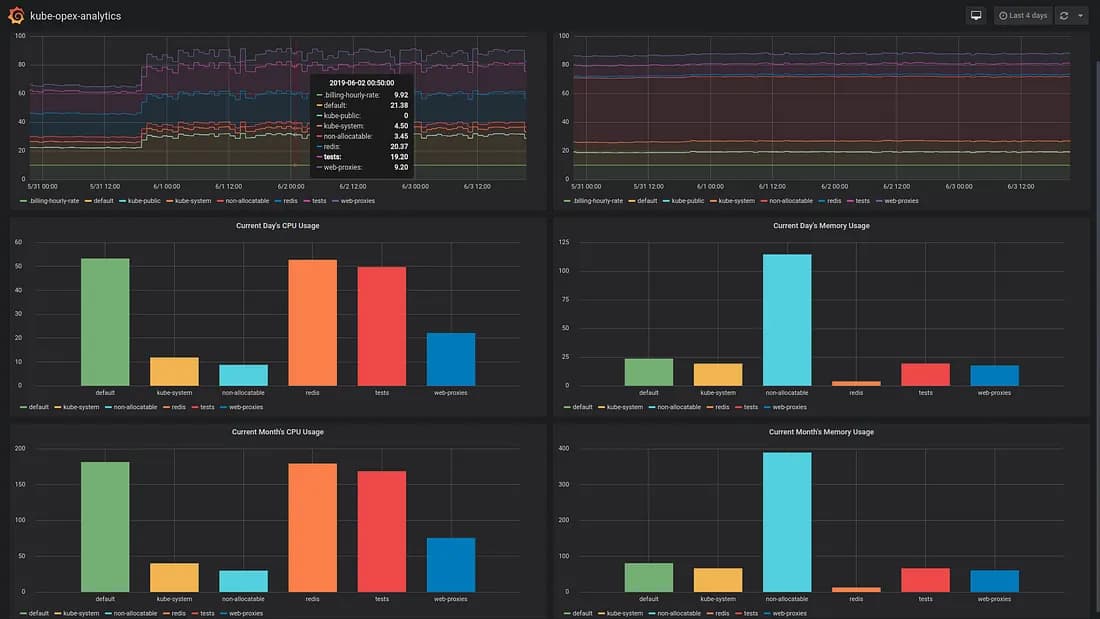
Efficient Visualization: For metrics it generates, Kubernetes Opex Analytics provides dashboards with relevant charts covering as well the last couple of hours than the last 12 months (i.e. year) as shown below.

Kubernetes Opex Analytics — Screenshot of the Built-in Dashboard
Installing Kubernetes Opex Analytics
Next on we assume that the installation will be done on a Kubernetes cluster, as you can also install it on Docker as described here.
There is a Helm chart to ease the deployment on Kubernetes, either by using Helm Tiller or kubectl.
In both cases check the values.yaml file to modify the configuration options according to your needs (e.g. to have persistent volume for data storage).
Using Helm Tiller:
helm upgrade \
  --install kube-opex-analytics \
  helm/kube-opex-analytics/
Using kubectl:
helm template \
  --name kube-opex-analytics \
  helm/kube-opex-analytics/ | kubectl apply -f -
This will enable the built-in dashboard via a HTTP service named kube-opex-analytics on port 80.
Prometheus Exporter
Metrics are exposed for Prometheus via the /metrics endpoint.
Exposed Metrics
As shown on the sample on Figure below the exposed metrics are:
koa_namespace_hourly_usage : exposes for each namespace its current hourly resource usage for both CPU and memory.
koa_namespace_daily_usage : exposes for each namespace and for the ongoing day, its current resource usage for both CPU and memory.
koa_namespace_monthly_usage : exposes for each namespace and for the ongoing month, its current resource usage for both CPU and memory.
Press enter or click to view image in full size

Kubernetes Opex Analytics — Sample of Metrics Exposed for Prometheus
Prometheus Scrape Job
The job can be configured like below. An interval less than 5 minutes (i.e. 300s) is useless as no new metrics will be generated within the meantime.
scrape_configs:
  - job_name: 'kube-opex-analytics'
    scrape_interval: 300s
    static_configs:
      - targets: ['kube-opex-analytics:80']
Recall that Kubernetes Opex Analytics works with hourly-consolidated metrics, so you may need to wait at least an hour to have all metrics available.
Grafana Dashboard
Once metrics available in Prometheus, get this Grafana Dashboard and import it into Grafana. The dashboard relies on a variable KOA_DS_PROMETHEUS that shall point to your Prometheus data source.
Once configured properly the dashboard shall just work out of the box to display charts as described hereafter.
Hourly Usage
There are two panels displaying respectively usage charts for CPU (left) and memory (right) over the selected interval (7 days by default). Series for the different namespaces are stacked. This makes usage comparison easy and also helps show how loaded the cluster is. On the below example we can see that during the last 5 days, global CPU and memory usage reached more than 90%.

Kubernetes Opex Analytics — Hourly Resource Usage
Current Day’s Usage
The two panels display respectively cost charts for CPU (left) and memory (right) over the ongoing day. Values are computed using cost algorithms described early in this story.

Kubernetes Opex Analytics — Current’s Day Resource Usage
Current Month’s Usage
The two panels below display respectively cost charts for CPU (left) and memory (right) over the ongoing month. Values computed using cost algorithms described early in this story.
Press enter or click to view image in full size

Kubernetes Opex Analytics — Current’s Month Resource Usage
Move forward
In short we’ve introduced in this story a Prometheus exporter as well as a Grafana dashboard for Kubernetes Opex Analytics.
As you may have noticed charts of the described Grafana dashboard are less rich than the ones of the built-in dashboard of Kubernetes Opex Analytics. For instance daily and monthly usage are limited to the current day, respectively current month. This makes difficult to compare current usage with previous ones. These are limitations inherent in how Grafana handles bar charts based on series names. The current implementation hence leaves room for further improvements, any contributions will be really appreciated.
I want to recall that Kubernetes Opex Analytics is open source, it’s an open-to-contribution project. We’re always pleased to receive feedback and contributions on Github: submit an issue if you encounter problems or have some ideas of improvement; make a pull request; or give a star.
Enjoy!